"As-Is" Versus "As-Was" - What's The Difference?
In this global & diversified environment, insurance companies every year become startups, change names, shut down operations, sell off products/entities, or merge with another insurance group. Analyzing and comparing these changing companies can be daunting and complex. There are two ways to look at the data resulting from these changes:
-
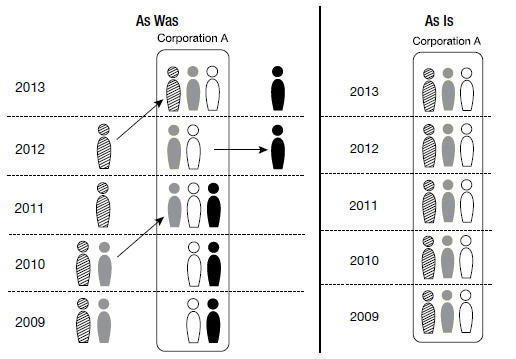
"As Is” analysis involves consolidating back-year data using the current year’s organizational structure. AM Best analysts study the structure of each insurance organization, and then update the results based on the current ownership. Therefore, prior-year data from units acquired, sold, closed, or opened are incorporated or deleted from the results as if the current structure had existed over the past 11 years. This is the standard presentation that AM Best uses for data as it can provide a more meaningful perspective on a group’s performance over the period of evaluation. As-Is data reflects a company's current structure projected backwards in time.
-
"As Was” analysis displays the data and organizational structures as it was filed at the end of each of the past 11 years. This data format provides a true picture of how each company/group existed at the end of each year.
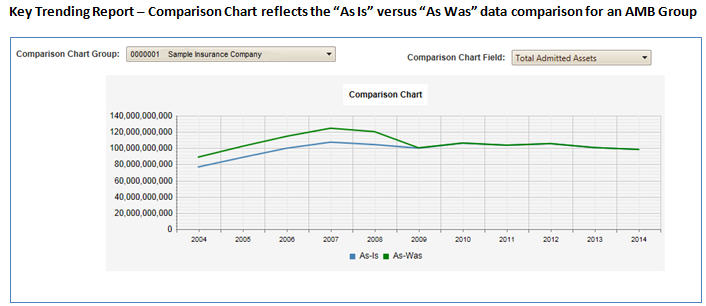
Comparing these two data sets side-by-side for consolidated data records provides the ability to analyze the financial performance of the group based on the current structure (“As Is”) and compare it to the actual results using the “As Was” structure. See an example of a Key Trending Report below.